From: County EOC
Shelter needed for 40 families
An AI reads each report and tells FEMA what to do first.
From: County EOC
Shelter needed for 40 families
Scanned PDF
From: Weather service
Flood warning on River Road
Spreadsheet
From: Hospital
Running on backup power
Priority list
Send: power crew, 2 buses, road team
When fires hit Los Angeles, help was slow. Not from a lack of data, but from how it moved.
Each county sent its own format.
Many departments had to say yes first.
No shared view, so teams could not act as one.
Too much data, in too many places, and no one view of it all.
The AI reads every report and ranks each task on five things.
The danger of the event.
Everyone in the area.
Hospitals, power stations and roads.
Groups who need extra help.
Rescue teams, medical teams, supplies.
A person makes the final call on every step.
Four screens we designed for a FEMA operator.
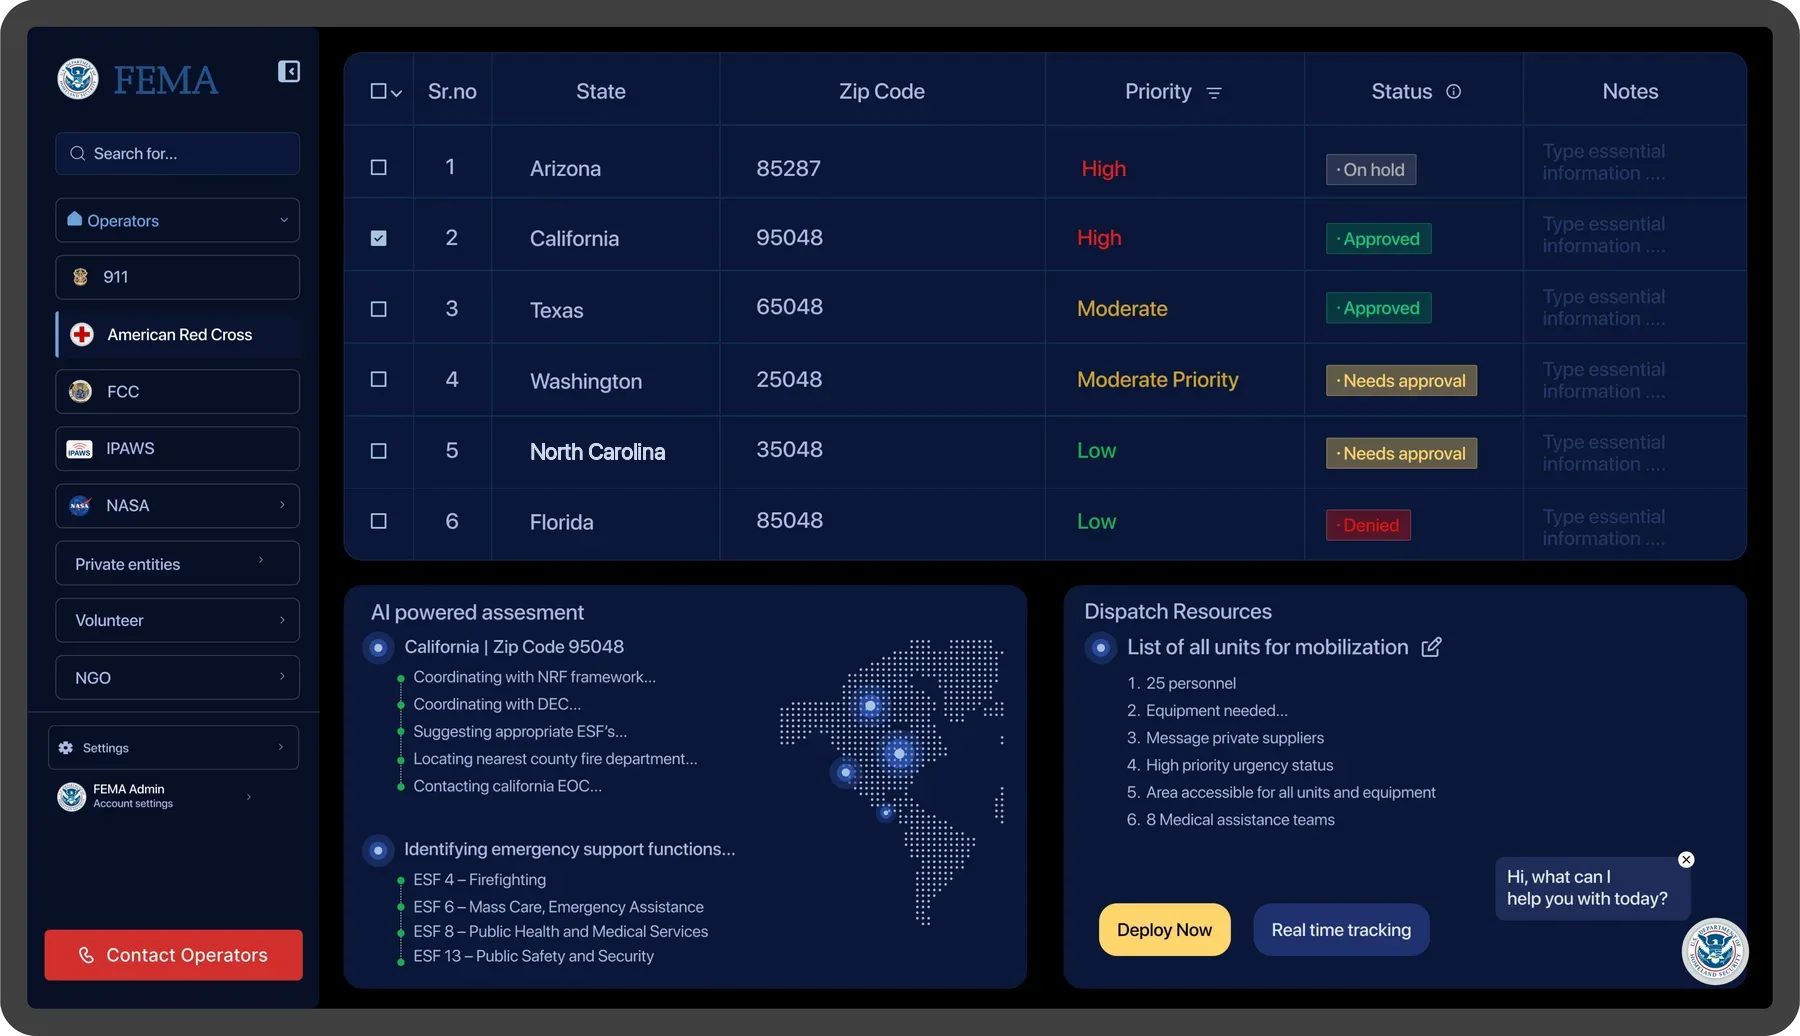
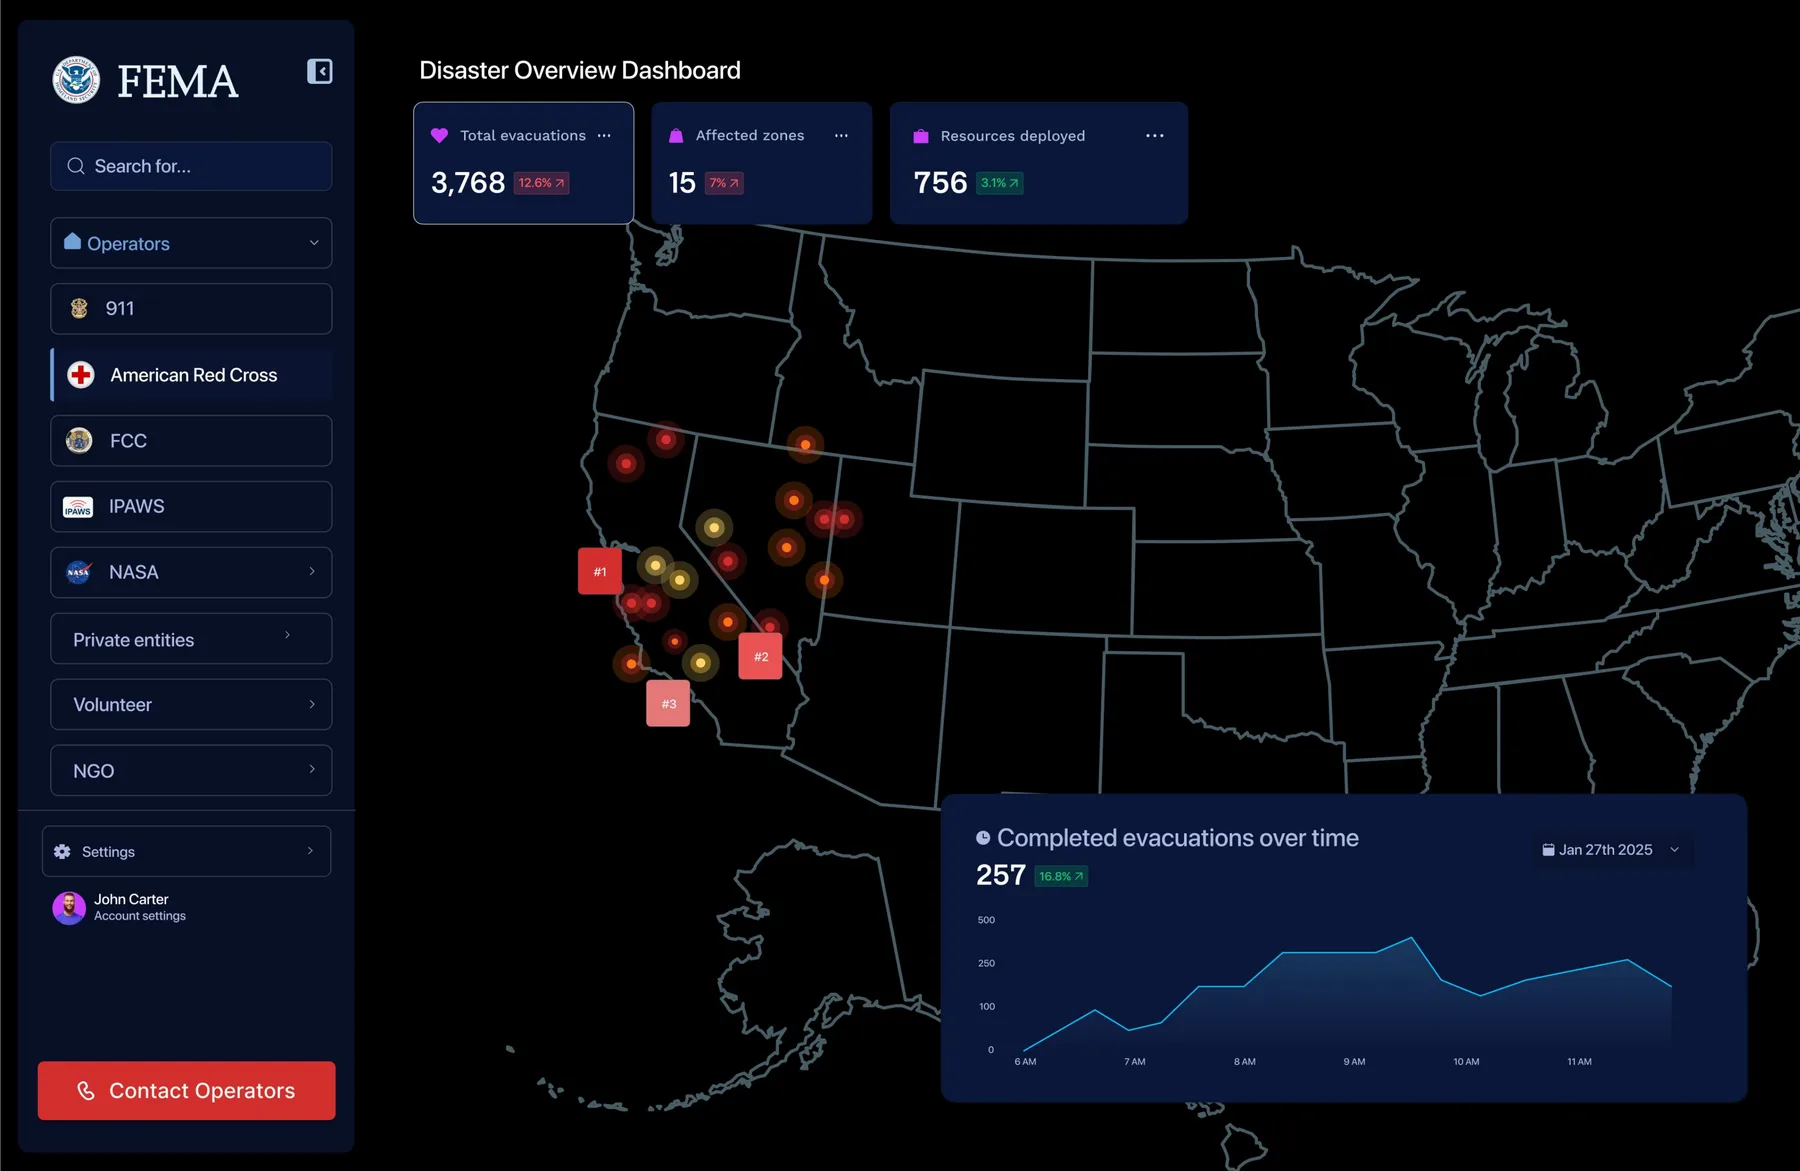
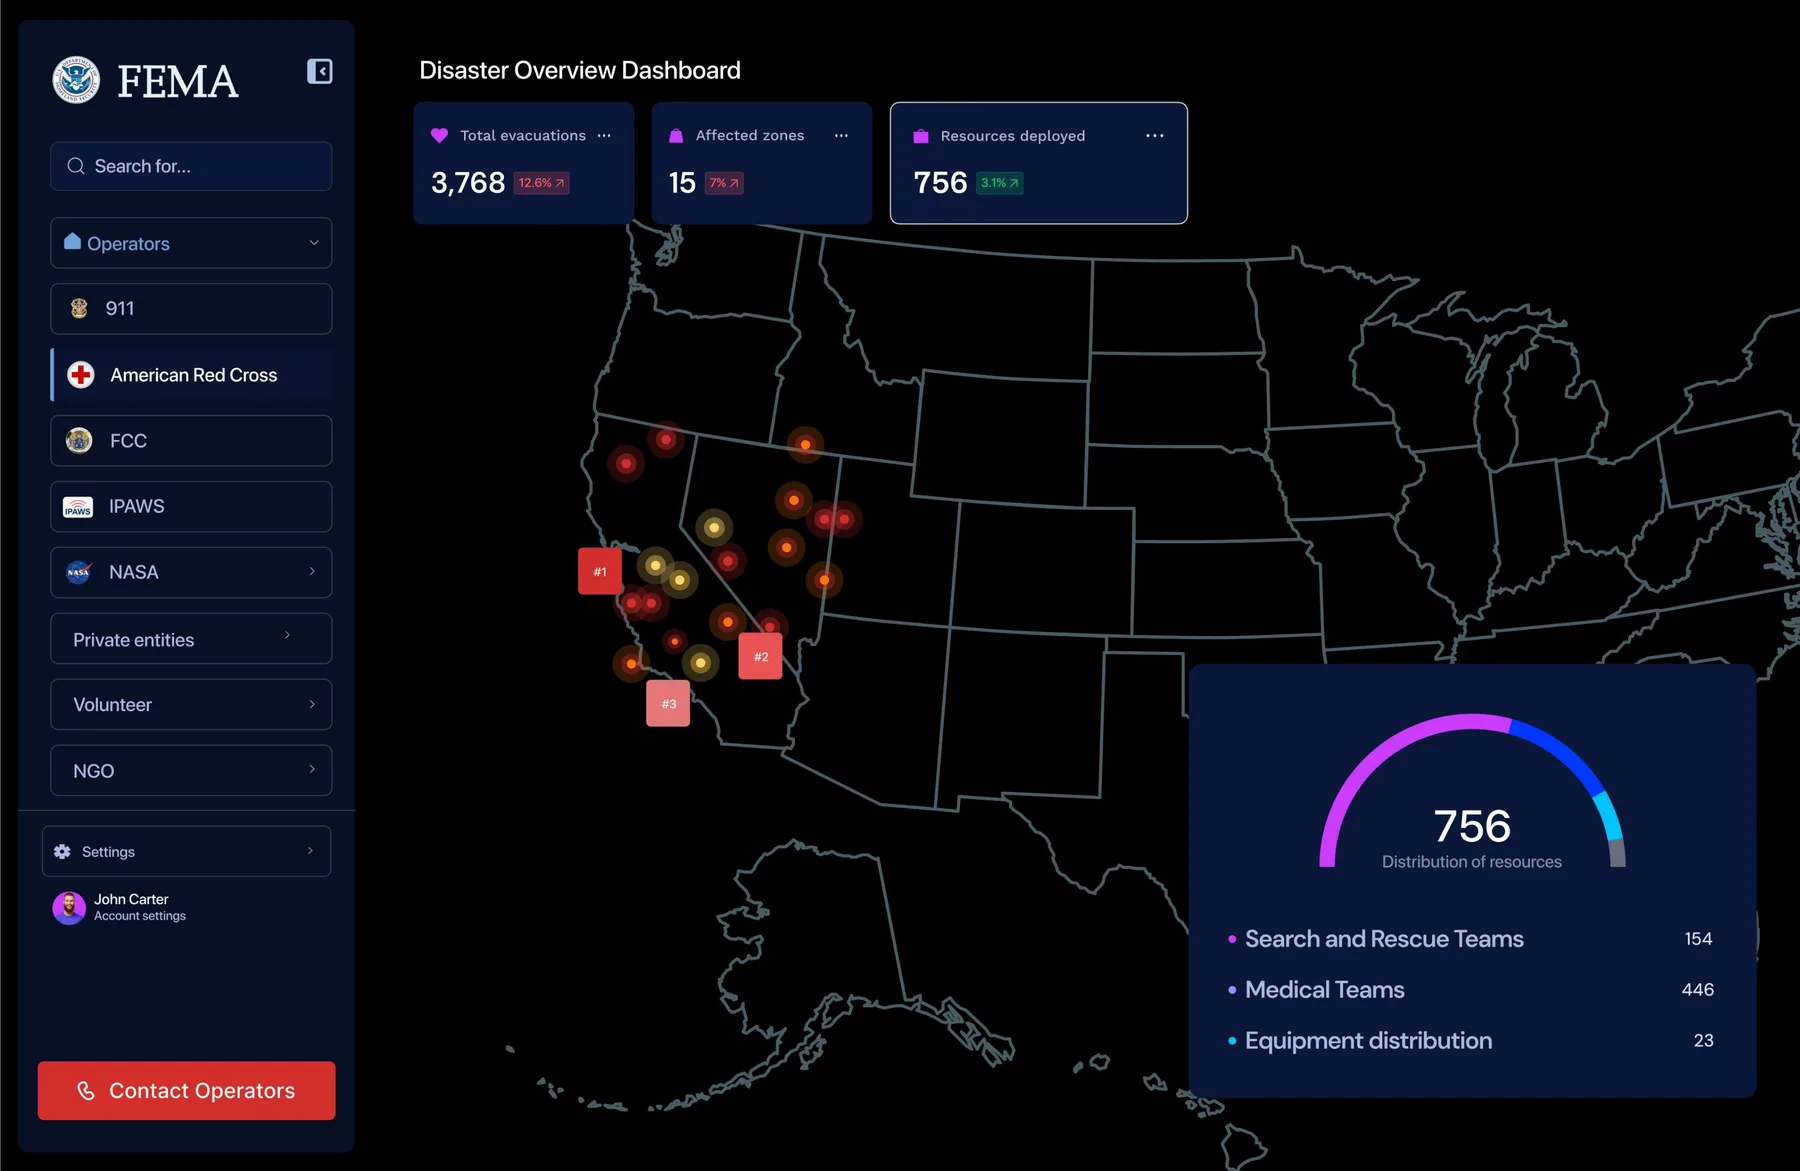
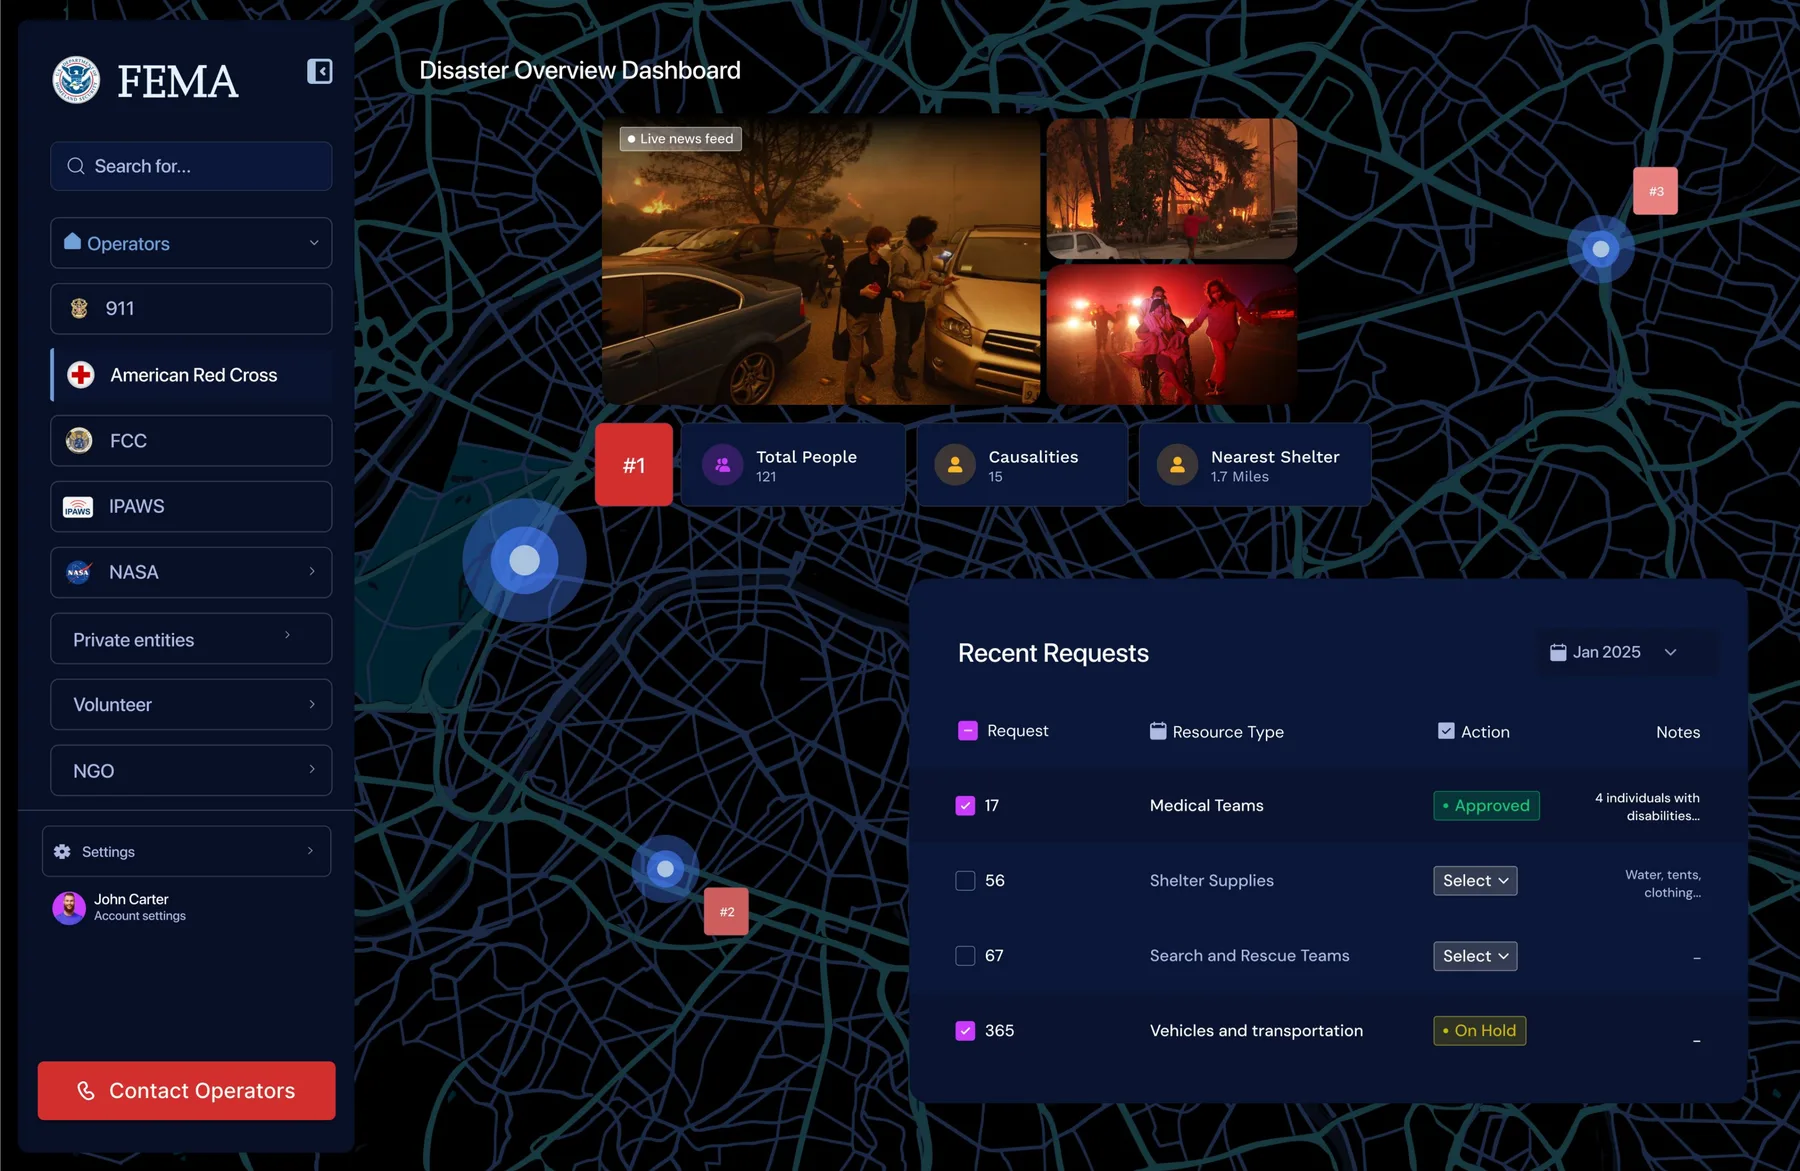
Before any screen, we planned it all on whiteboards.
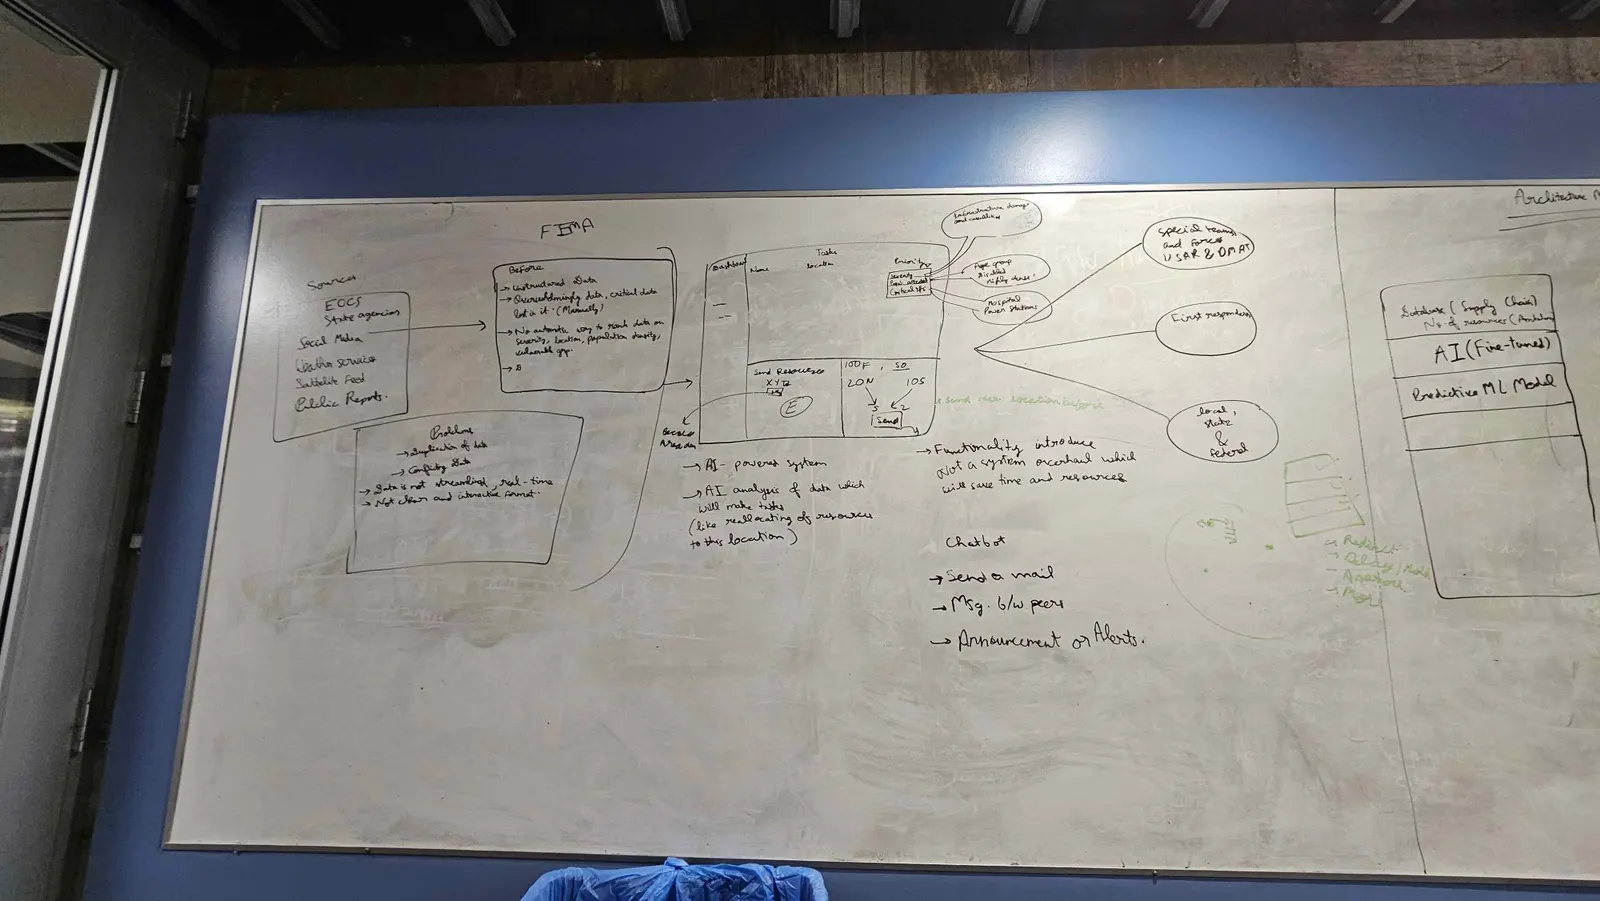
Who sends data, what goes wrong, and what to send back.
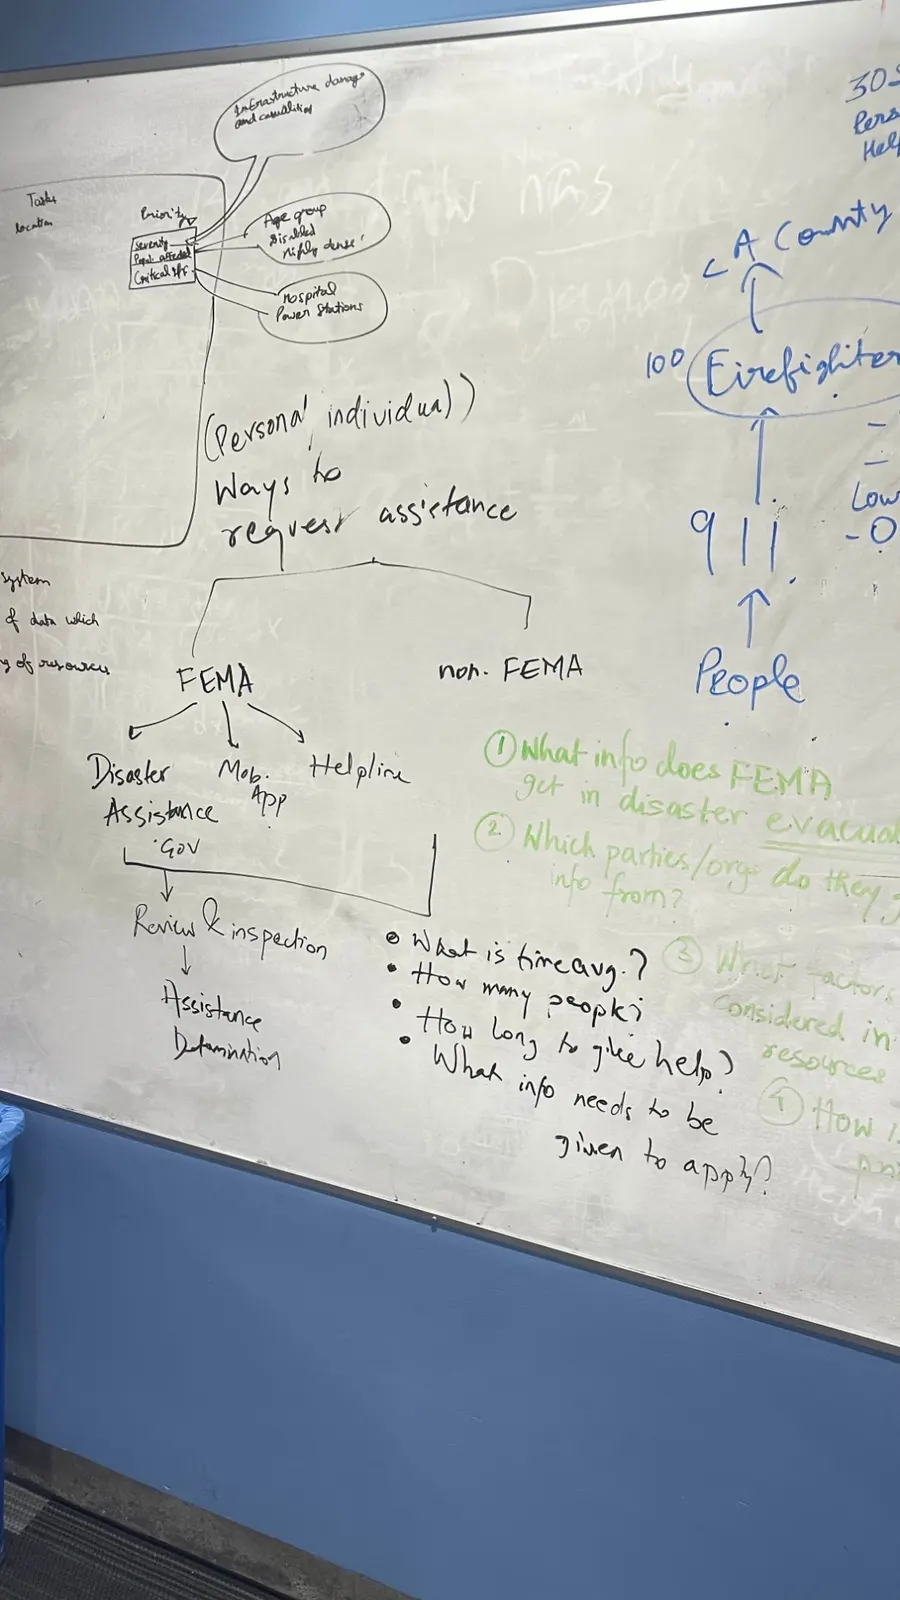
How people ask FEMA for help today.
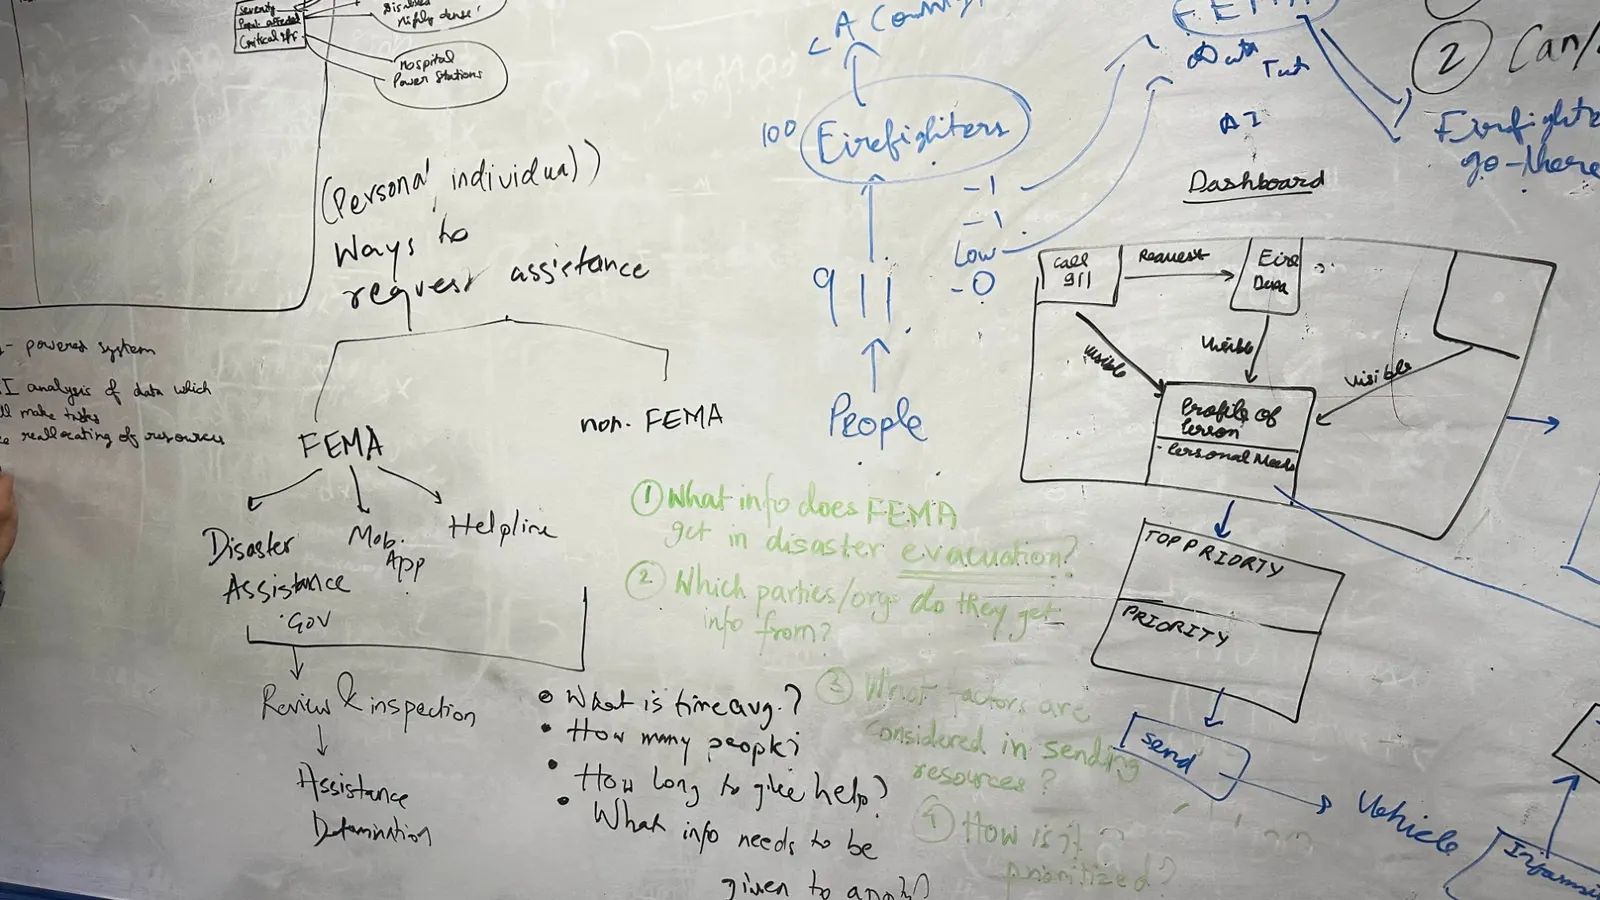
A 911 call joins a queue, and a truck goes out.
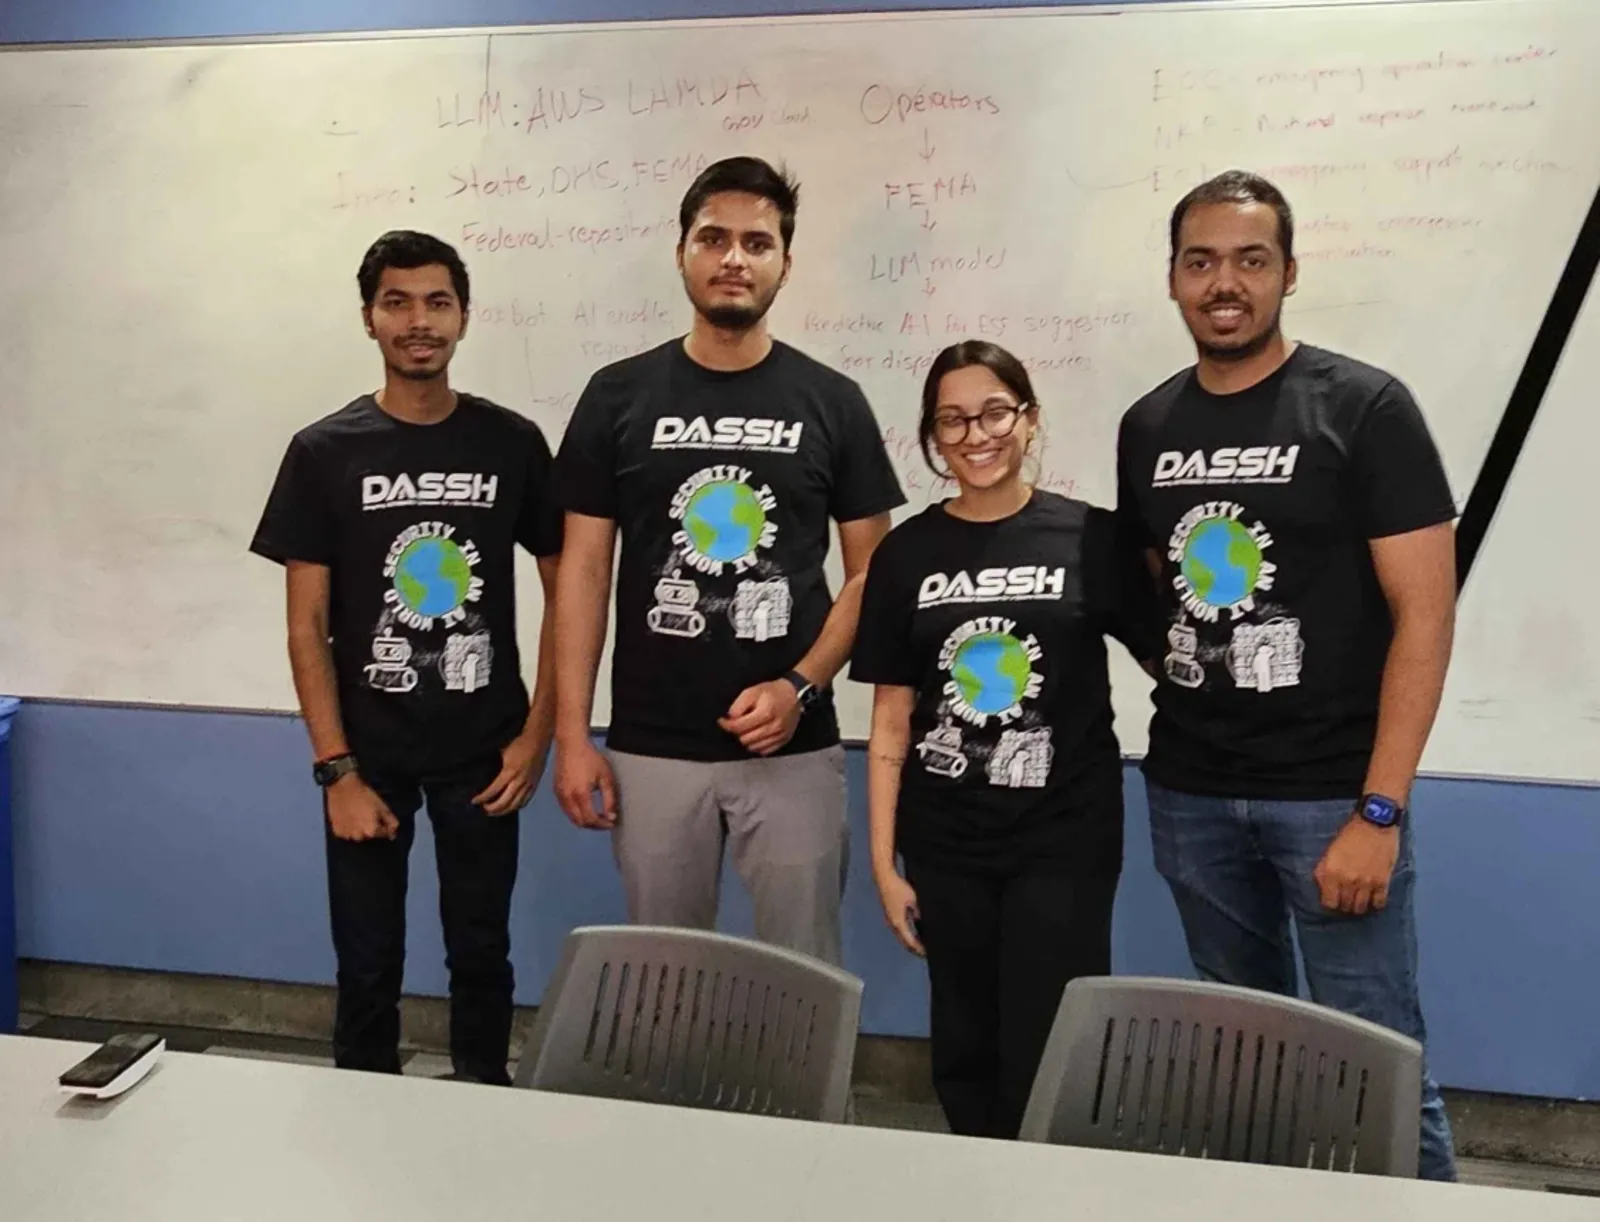
Four of us, in front of the plan.
Our team’s estimates, from federal reviews.
Next to the tools in use today.
| Can it | By hand | Rule based | Map tool | Static dashboard | Our AI dashboard |
|---|---|---|---|---|---|
| Pull in data live | No | No | Yes | No | Yes |
| Rank by how bad it is | No | Yes | No | No | Yes |
| Read PDFs, emails and posts | No | No | No | No | Yes |
| Suggest what to send | No | No | No | No | Yes |
| Flag reports that disagree | No | No | No | No | Yes |
| Leave the final call to a person | Yes | Yes | Yes | Yes | Yes |
Our DHS DASSH Challenge pitch, with subtitles. I built the AI and ML side.